
What is cross-functional reporting in a food supply chain?
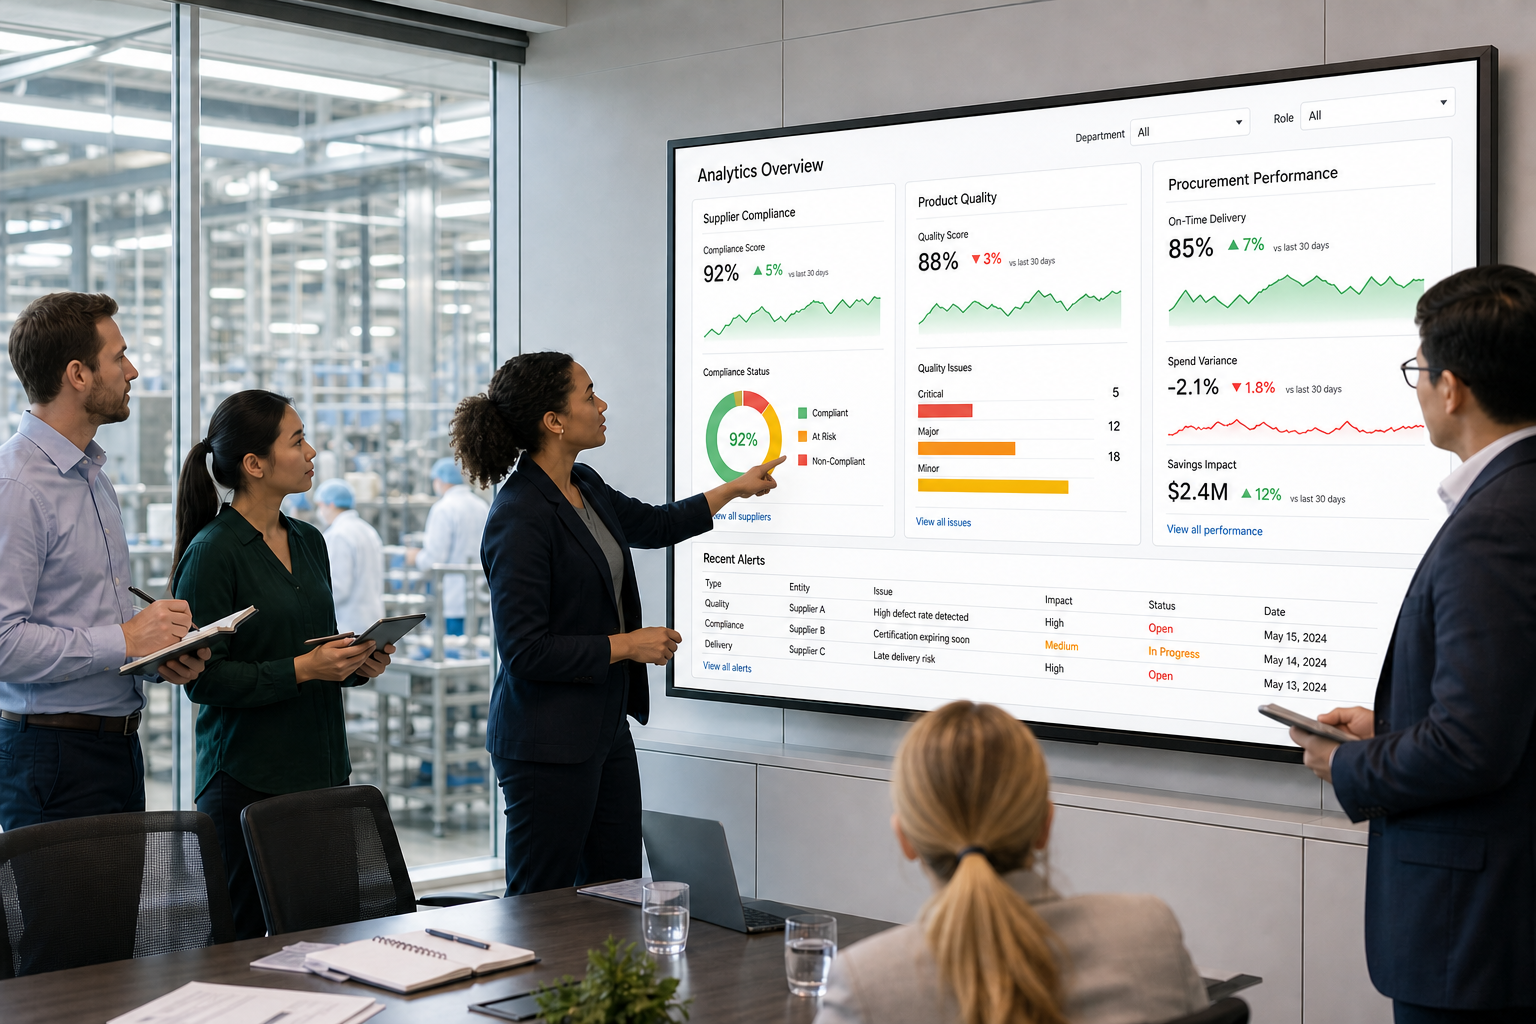
Cross-functional reporting brings quality, supplier, production and commercial data into one shared view, so every leader is looking at the same facts about risk and performance. Instead of each function producing its own report from its own system, one set of connected dashboards answers the question the board actually asks: where are we exposed, and what are we doing about it?
For a food manufacturer, retailer or foodservice group running many sites and hundreds of suppliers, that distinction matters. A quality manager may see a rise in complaints, procurement may see a supplier price move, and operations may see a yield dip. Each is a symptom. Without a joined-up view, nobody sees the single cause behind all three.
Why this is a leadership question, not a reporting question
Technology investment alone does not close the gap. PwC's 2025 Digital Trends in Operations Survey of 610 US operations and supply chain leaders found that 92% cite at least one reason their technology investments fell short. The most common were integration complexity (47%) and data issues (44%). The tools were bought, but the data still does not connect.
The cost of that gap shows up when something goes wrong. A 2025 peer-reviewed study in the Journal of Food Protection used expert elicitation to estimate the cost of overly broad recalls, where a whole product category is pulled because the source cannot be identified quickly. It put the median cost to producers at between $3.0 million and $72.7 million per firm, depending on size. Executives rarely choose when a recall happens. They do, however, choose how quickly the organisation can see a problem forming. And when problems cross functional lines, reporting usually does not.
Three signs your food business reporting is siloed
1. The same issue is logged three times, in three formats
A supplier problem appears as a complaint in one system, a non-conformance in another and a spreadsheet note in a third. Each record is accurate. None shows the pattern.
2. Supplier performance is judged on one dimension
Procurement ranks suppliers on cost. Quality ranks them on audit results. Leadership receives two lists and no agreed view of which suppliers are genuinely lowest-risk and best value.
3. Leadership packs are assembled by hand
If preparing a monthly performance view means reconciling files from several teams, the numbers are out of date before they arrive, and nobody has time to question them.
What good cross-functional reporting looks like
- One source of truth. Quality, supplier, production and commercial data sit in a connected platform rather than in separate files.
- Shared definitions. A non-conformance, a complaint and a supplier score mean the same thing at every site and in every department.
- The right view for each audience. A plant manager, a head of quality and a board member need different dashboards built on the same data.
- A closed loop. Findings become assigned actions with deadlines, and progress stays visible until they are resolved.
How Foods Connected can help your food business reporting
Foods Connected links supplier, quality, production and compliance data to the product itself, so reporting becomes control over what you make, who supplies it and how you prove it.
- PLM: Specifications are version-controlled, with formulation and labelling in one record from concept to launch, linked to approved suppliers.
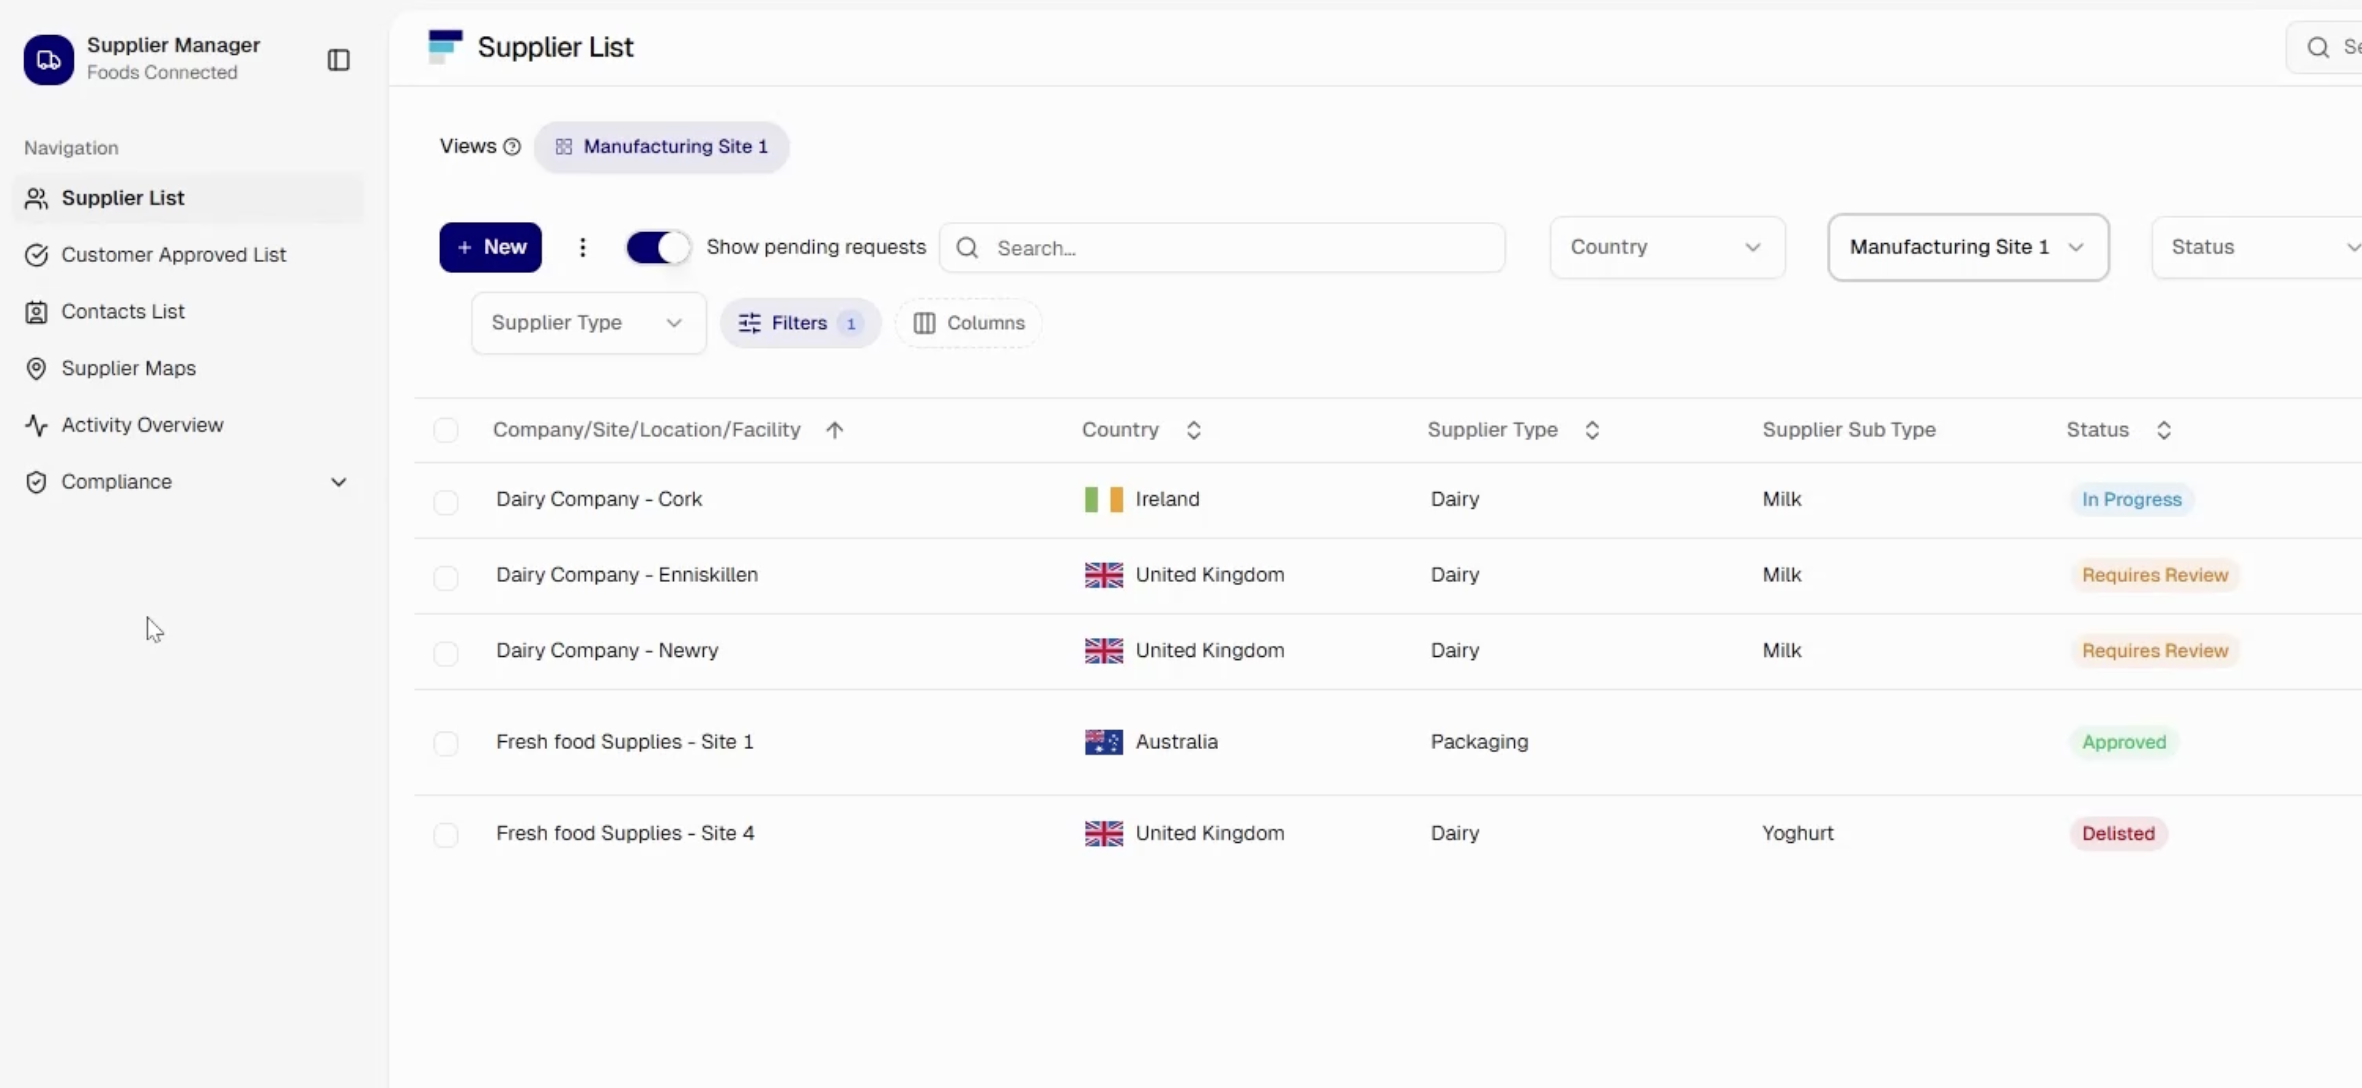
- Supplier compliance: Onboarding, approval, certificates with automatic expiry alerts, and audit findings with corrective actions sit in one place.
- Food safety and quality: HACCP monitoring, inspections and non-conformances are captured in a standard format and escalated automatically into CAPA, with deadlines and real-time tracking.
- One view: Connected dashboards show issues, audit scores and trends across sites and suppliers, from plant manager to board.
It works alongside your ERP, which remains the system of record for orders, stock and finance.
Five questions for your next leadership review
- How many systems does a single supplier issue pass through before it reaches a report?
- Do quality, procurement and operations use the same definition of supplier performance?
- How long does it take to produce a cross-site view of non-conformances and complaints?
- When an issue is raised, can you see who owns the action and when it is due?
- Would you learn about a recurring supplier problem from a dashboard, or from a customer?
A practical next step
Start with one recurring risk, such as a supplier with repeat non-conformances, and trace how many teams and systems it passes through. That map shows you exactly where reporting breaks.
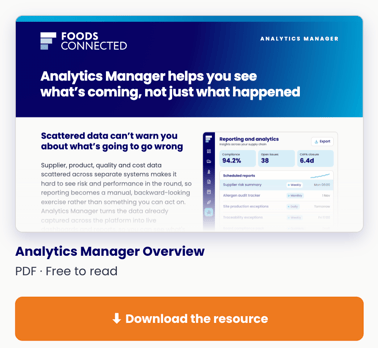
To see how connected reporting works across quality, supplier and production data, explore the Reporting & Analytics solution at Foods Connected or download the overview by clicking the link below.

Foods Connected team
The Foods Connected team of experts all come from industry and are specialists in food safety compliance, strategic sourcing, traceability and animal welfare.
Browse Posts






- November 2026
- October 2026
- September 2026
- August 2026
- July 2026
- June 2026
- May 2026
- April 2026
- March 2026
- February 2026
- January 2026
- December 2025
- November 2025
- October 2025
- September 2025
- August 2025
- July 2025
- June 2025
- May 2025
- April 2025
- March 2025
- February 2025
- January 2025
- December 2024
- November 2024
- October 2024
- September 2024
- August 2024
- July 2024
- June 2024
- May 2024
- April 2024
- March 2024
- February 2024
- January 2024
- December 2023
- November 2023
- October 2023
- September 2023
- August 2023
- July 2023
- June 2023
- May 2023
- April 2023
- March 2023